



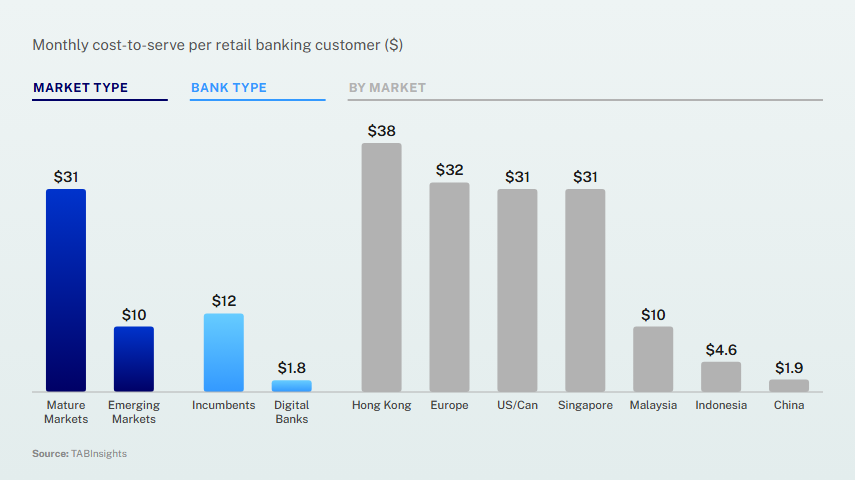

In the debate about cost efficiencies between digital and incumbent banks, cost-to-serve per customer is a key metric used to demonstrate the operational advantage of digital banks. In our sample, digital banks spend a median of $1.8 per month to serve their retail clients, around a seventh of the $12 spent by incumbents. This advantage is structural. Without branch networks or decades of legacy systems, digital banks can operate on cloud-based cores and automate onboarding and servicing. A digital bank built on a modern platform can operate with a cost base 40% to 80% below that of a mid-tier traditional bank.
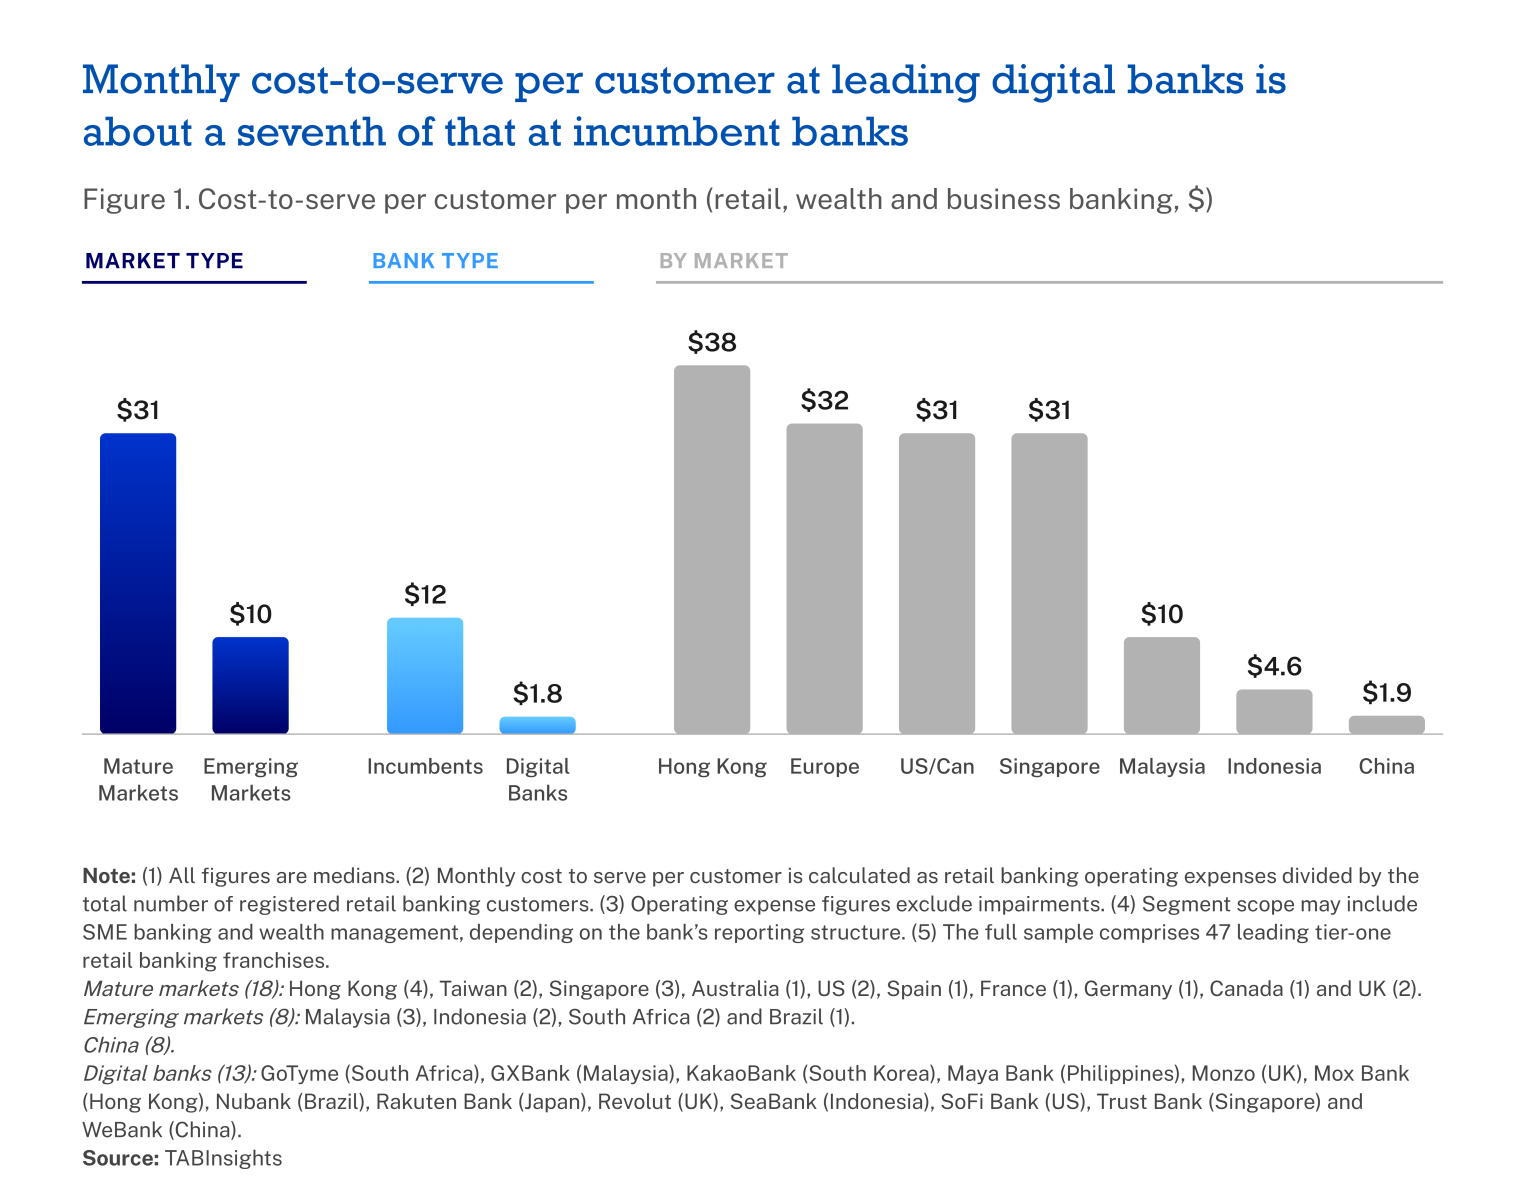
Among the World’s Best 100 Digital Banks, the leading banks kept monthly cost-to-serve below $2 per registered user, ranging from $1.76 at Rakuten Bank Japan, $1.58 at KakaoBank and $1.56 at Nubank, to $0.71 at GoTyme, $0.60 at Maya Bank in the Philippines and $0.25 at WeBank. Leading incumbents with the exception of Chinese banks in retail banking span a far wider range. Chinese incumbents serve vast mass-market bases at $1.6–$3.4, but elsewhere in emerging and mature markets cost to serve varies widely.
Low cost-to-serve does not account for differences in customer value
Much of the gap between digital banks and incumbents reflects not only differences in technology infrastructure but also differences in business mix. Incumbents typically serve mortgage, affluent and wealth customers through full-service franchises that include branches, advisers, cash handling and broader balance-sheet products. As a result, they generate more monthly revenue per customer than digital banks.
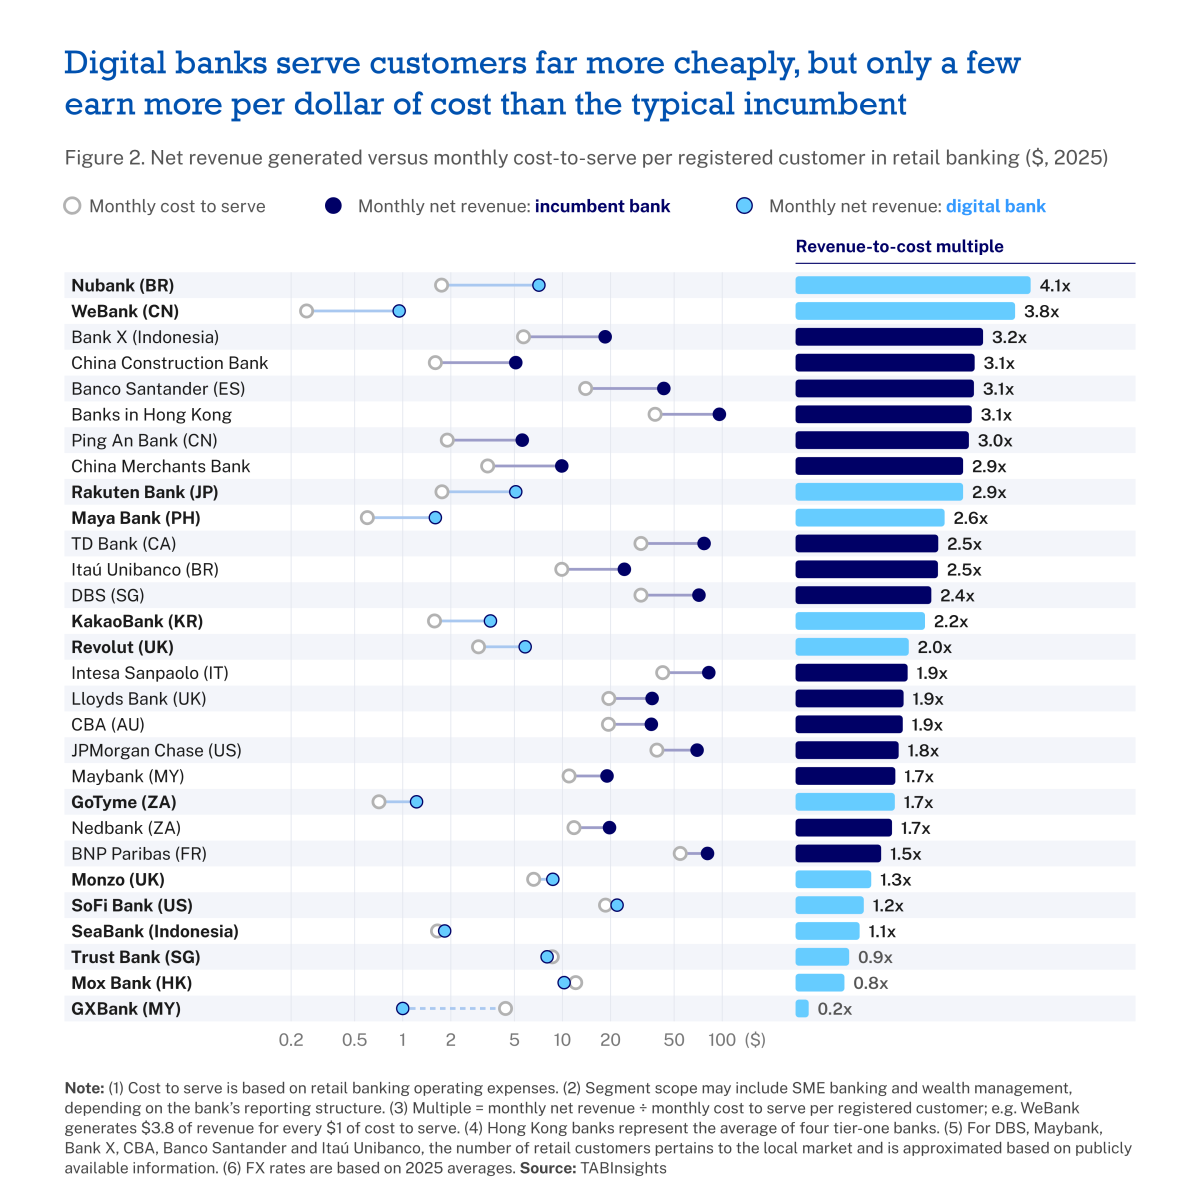
Digital banks generally started with younger, lower-balance customers and narrower offerings centred on cards, payments, deposits and unsecured credit, with some lending distributed through partners. Other structural factors also affect the comparison, including the more extensive regulatory and capital requirements faced by incumbents, differences in labour and property costs across markets and whether banks report registered or active customers. Cost-to-serve alone therefore provides an incomplete basis for comparison. A more revealing measure is the revenue generated for every $1 spent on serving customers. On this basis, most incumbents still outperform digital banks, with Nubank and WeBank the notable exceptions, followed by Rakuten Bank of Japan and Maya Bank in the Philippines to a lesser extent.
Scale and product expansion shape digital banks’ cost trajectories
Nubank's full monthly cost-to-serve per registered customer fell from $1.38 in 2017, when it had around 3 million customers, to $1.05 in 2020, as a growing customer base absorbed a largely single-product, single-market platform. It then rose to $1.73 by 2023, as the bank entered Mexico and Colombia and added loans, investments and insurance. Between 2023 and 2025, the figure remained broadly stable, at $1.75, despite growth to 131 million users, as scale absorbed the new cost base.
Revolut followed a different trajectory. It’s monthly cost to serve rose from $0.77 in 2017 when it had around 1.2 million users, to $2.91 in 2025, when its customer base reached 69.1 million. That represents a 278% increase over the period, against 27% at Nubank, reflecting a business that kept adding currencies, markets and licences, along with associated compliance cost, including those leading up to its full UK banking licence in March 2026.
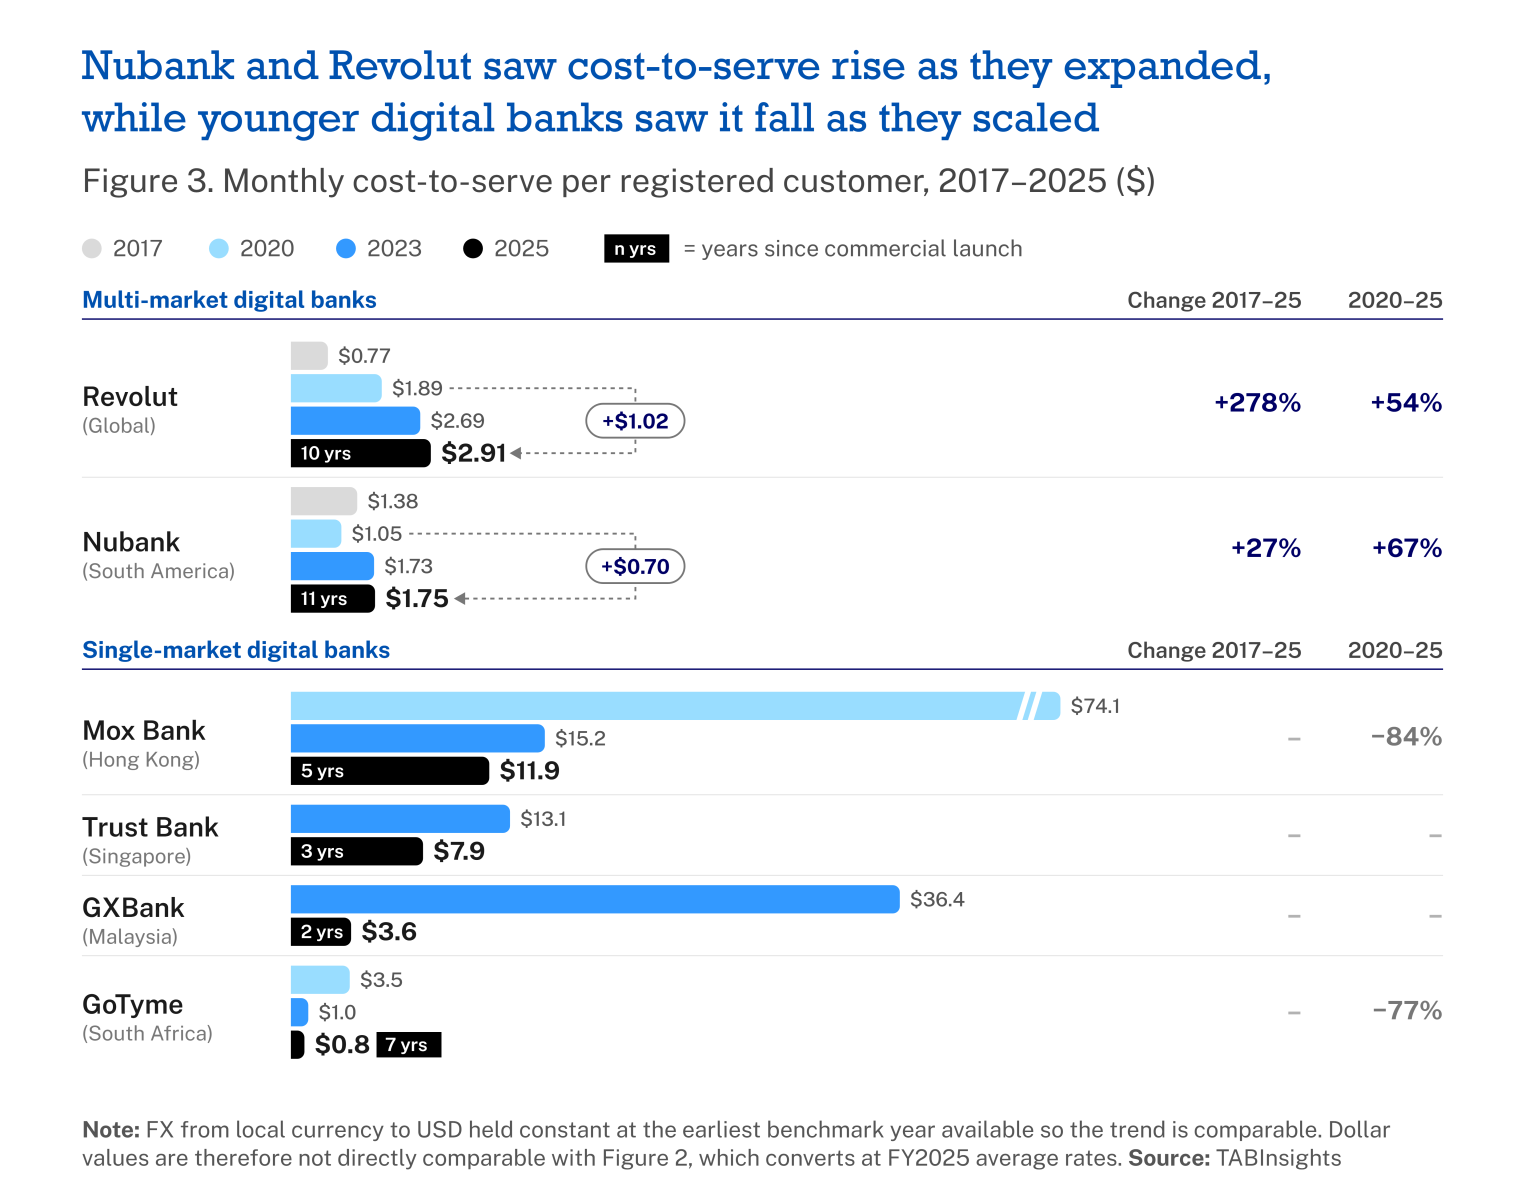
Newer digital banks have followed a different cost trajectory, with cost-to-serve gradually declining as their customer bases grow. GoTyme in South Africa, GXBank in Malaysia, Trust Bank in Singapore and Mox Bank in Hong Kong were licensed as banks from the outset, under regulators that expect them to establish mature governance and controls from the first day of operation. They have therefore taken on the fixed control costs that Nubank and Revolut added gradually. Those costs are spread across customer bases of around one million or fewer, leaving monthly cost-to-serve high in their early years.
Marketing, rather than customer servicing, drove cost increases at Nubank and Revolut. In neither case did frontline servicing drive the increase in overall cost-to-serve. Nubank spent more in aggregate on servicing-related costs, but these became cheaper on a per-customer basis as it scaled. Combined specialised services and customer-service expenses rose 3.4 times, from $57.0 million in 2020 to $195.0 million in 2025, even as its customer base expanded from 33.3 million to 131.1 million. As a result, the combined monthly cost per customer fell from about $0.14 to $0.12.
Marketing, by contrast, became a much larger cost for both banks between 2020 and 2025, although its weight in their cost structures differed. Nubank's marketing spend rose 16.5 times, from $16.5 million to $271.1 million, making it the fastest growing cost line. Marketing cost per customer increased from about $0.04 to $0.17 per month, accounting for roughly 19% of the $0.70 increase in overall monthly cost-to- serve. Even so, marketing remained relatively modest at about 10% of Nubank's operating expenses in 2025.The cost is likely to rise further in 2026. Despite launching its US offering nationwide in September 2026 through a partner bank while waiting for a new digital bank licence, its brand-building, remains anchored in Miami, Florida. In March 2026, Nu signed a multiyear partnership with Inter Miami CF, the Major League Soccer club, which includes naming rights to the club's new stadium, now Nu Stadium.
At Revolut, advertising and marketing is a far larger part of the expense structure. Spending reached GBP 528.8 million ($693 million) in 2025, about $0.63 per customer per month and contributing 29% to its entire cost base. The mix of that spending has also changed. Revolut built its early growth on referrals and performance-led digital marketing, including paid search and social advertising measured by the sign-ups it produced. Since 2022, however, Revolut has expanded into broader brand and physical-world advertising. In January 2025, it launched “Money Possibilities”, a global campaign that ran across film, out-of-home and digital out-of-home advertising, social media and audio in more than 20 countries.
Like Nubank, sports sponsorship has also become an increasingly prominent part of the mix. Revolut is the title partner of the Audi Revolut F1 Team, which joined the Formula 1 grid in 2026, while its portfolio has included Manchester City’s men’s and women’s teams and the NBA London and Berlin games in 2026. In June 2026, Manchester City striker Erling Haaland fronted its “Welcome to my Bank” campaign. The scale of its brand investment increased sharply in 2025. Revolut said it ran 41 above-the-line campaigns during the year, expanded its presence into 18 new airports across 11 countries and increased marketing investment by 47%. Word of mouth nevertheless remained its main customer-acquisition channel. Revolut claims that more than 63% of the 16 million new retail customers it added in 2025 joined through referrals or word of mouth. This suggests that brand spending is intended not only to attract new customers but also to build the trust needed to win primary banking relationships.
Revenue growth, not low costs alone, determines digital-bank economics
Lower cost to serve alone does not make a digital bank viable. Across several key digital banks in Figure 4, net revenue grew faster than operating expenses between 2020 and 2025, often by a wide margin. Revolut’s revenue rose 53x, compared with 6.8x for expenses, while GoTyme’s increased 31x, compared with 1.3x for expenses. These differences show why cost discipline and scale, while necessary, are not sufficient. Digital banks must also turn customer growth and product expansion into higher revenue per customer to achieve stronger economics.
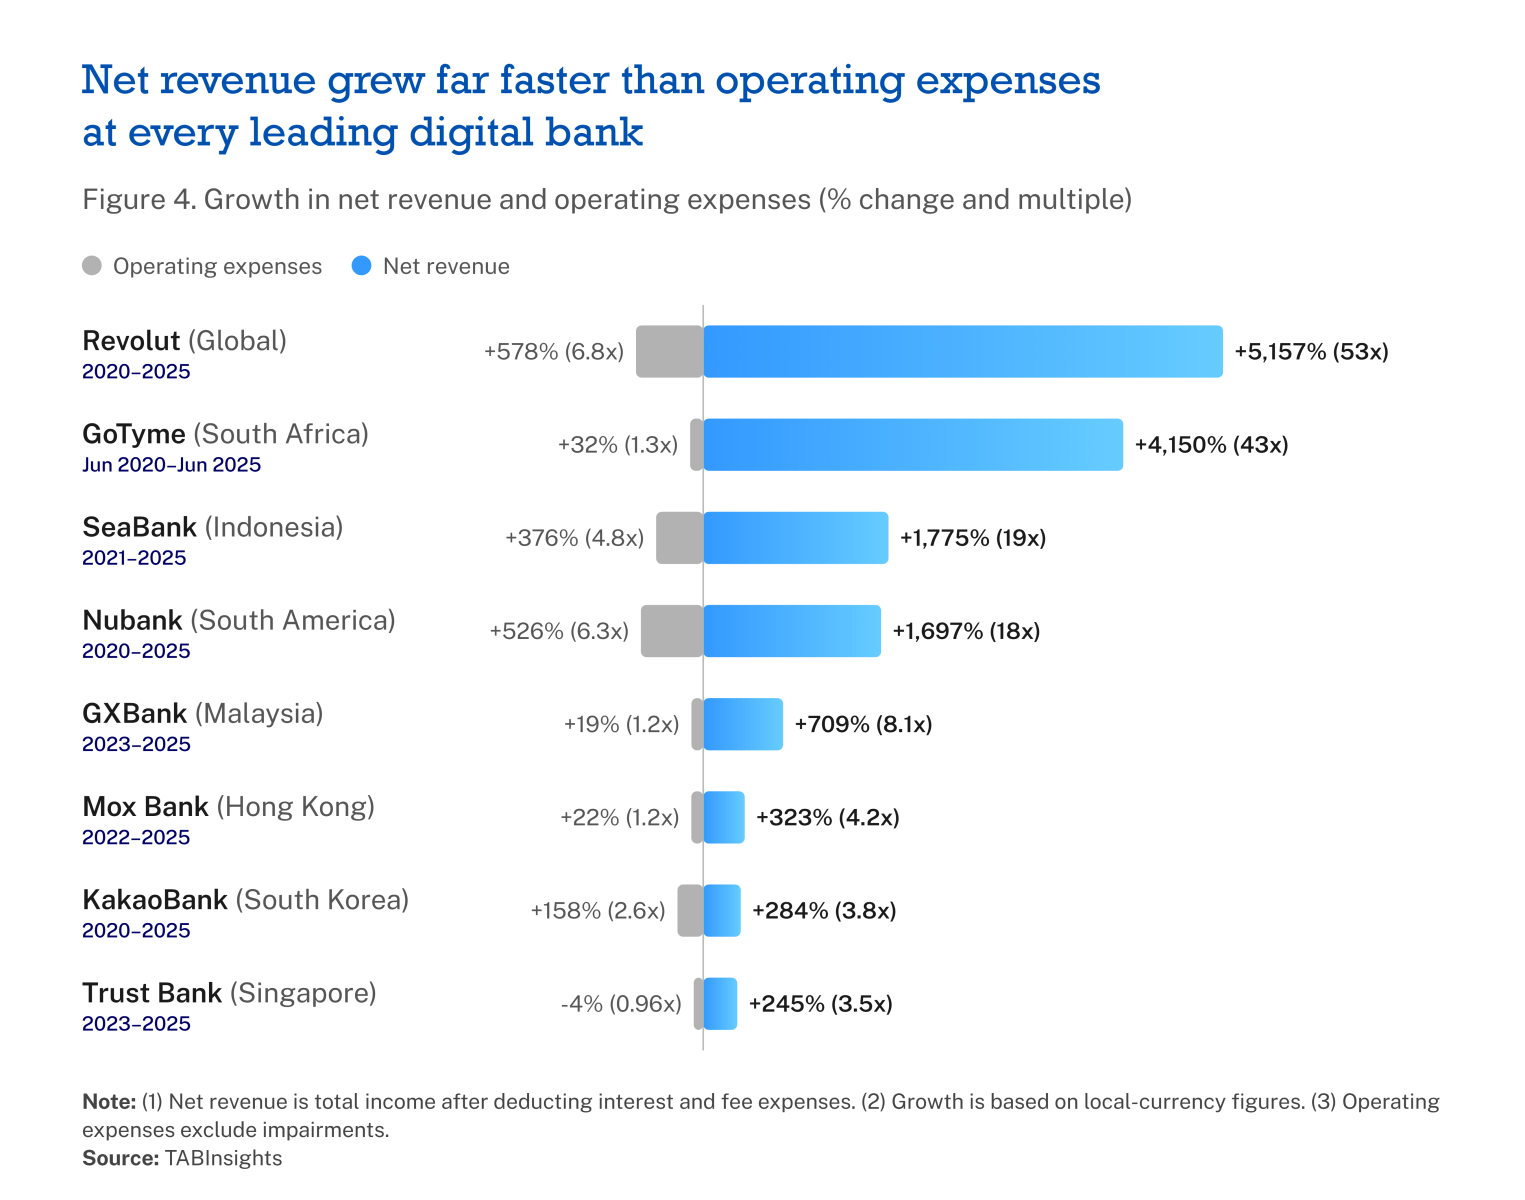
Three implications follow for digital banks. First, scale should lower cost per customer as the customer base grows, rather than simply adding to the cost base. Nubank's decline from $1.38 to $1.05 between 2017 and 2020, and its plateau after 2023, show what happens when customer growth outpaces the addition of fixed costs. Second, expansion into new products and markets creates additional costs before the associated revenue materialises. Each move into lending, wealth management or new markets adds a fresh step of fixed cost before the matching revenue arrives. Revolut's multi-currency, multi-market model now costs about 1.7 times as much per customer (Figure 3) as Nubank's concentrated three-country operation, suggesting that building depth in existing markets can be a cheaper route to scale than expanding internationally early on.
Third, revenue growth is the decisive measure of progress. Revolut's monthly cost to serve per customer rose 54% between 2020 and 2025 at constant FX, yet its cost base fell from 288% to 51% of net revenue, while pre-tax profit reached GBP 1.7 billion ($ 2.23 billion). For newer digital banks, progress should therefore be measured not simply by how far they can reduce cost-to-serve, but by how quickly lending, card and fee income can lift revenue per customer above the cost of operating under their banking licences. A high cost-to-serve may reflect an early stage of growth rather than operational inefficiency.
Subscribe for regular insights.



Banner.png)



.png)






 Google
  LinkedIn